


1.安装chrony时间同步服务器
1.所有节点安装chrony服务
[root@prometheus_servers_131 ~]# yum -y install chrony
[root@prometheus_servers_132 ~]# yum -y install chrony
[root@prometheus_servers_133 ~]# yum -y install chrony
[root@prometheus_nodes_141 ~]# yum -y install chrony
[root@prometheus_nodes_142 ~]# yum -y install chrony
[root@prometheus_nodes_143 ~]# yum -y install chrony                                  #有外网可以直接yum安装
[root@prometheus_servers_131 ~]# yum -y install chrony --downloadonly --downloaddir=./  #安装离线rpm包
[root@prometheus_servers_131 ~]# ll
total 312
-rw-r--r-- 1 root root 256528 Aug 23  2019 chrony-3.4-1.el7.x86_64.rpm
-rw-r--r-- 1 root root  57460 Apr  4  2020 libseccomp-2.3.1-4.el7.x86_64.rpm

2.添加hosts文件解析,注:这里也是所有节点配置hosts文件解析
[root@prometheus_servers_131 ~]# echo 10.0.0.131 prometheus_server_131 >> /etc/hosts

3.修改时间服务器配置文件
[root@prometheus_servers_131 ~]# vim /etc/chrony.conf
...
#server 0.centos.pool.ntp.org iburst
#server 1.centos.pool.ntp.org iburst
#server 2.centos.pool.ntp.org iburst
#server 3.centos.pool.ntp.org iburst
# 将默认的时间服务器注释掉,因为可能你的虚拟机无法联网
# 此处我将当前节点设置为时间服务器。
server prometheus_server_131 iburst

# 指定允许访问的客户端地址列表
allow 10.0.0.0/24

# 当远程时间服务器和本地时间服务器冲突时,优先使用本地。
local stratum 10

4.重启chrony服务
[root@prometheus_servers_131 ~]# systemctl restart chronyd

5.修改客户端配置,注:所有节点修改配置文件
[root@prometheus_nodes_141 ~]# vim /etc/chrony.conf
...
#server 0.centos.pool.ntp.org iburst
#server 1.centos.pool.ntp.org iburst
#server 2.centos.pool.ntp.org iburst
#server 3.centos.pool.ntp.org iburst
# 将默认的时间服务器注释掉,因为可能你的虚拟机无法联网
# 此处指定我们自定义的时间服务器
server prometheus_server_131 iburst

6.重启chrony
[root@prometheus_nodes_141 ~]# systemctl restart chronyd

7.测试时间服务器是否生效
(1) 在服务端修改时间
[root@prometheus_servers_131 ~]# date -s "2024-10-01 08:30:00"
(2) 重启服务
[root@prometheus_servers_131 ~]# systemctl restart chronyd
(3) 查看其他节点是否同步服务端,与服务端时间一致,有的可能比较慢,重启服务即可
[root@prometheus_nodes_141 ~]# data -R
(4) 将时间修改当前时间
[root@prometheus_servers_131 ~]# ntpdata ntp.aliyun.com
(5) 查看其他节点时间也服务端一直,回到当前时间
[root@prometheus_nodes_141 ~]# data -R
2.安装Prometheus
1.准备工作目录
[root@prometheus_servers_131 ~]# mkdir -pv /zy/{app,data,logs}
2.二进制部署prometheus-server
https://prometheus.io/download  #官方安装地址
[root@prometheus_servers_131 ~]# wget https://github.com/prometheus/prometheus/releases/download/v2.53.3/prometheus-2.53.3.linux-amd64.tar.gz
3.解压软件包
[root@prometheus_servers_131 ~]# tar xf prometheus-2.53.3.linux-amd64.tar.gz -C /zy/app/
4.启动Prometheus
[root@prometheus_servers_131 ~]# cd /zy/app/prometheus-2.53.3.linux-amd64/ && ./prometheus
5.通过浏览器访问9090端口
http://10.0.0.131:9090/
6.编写启动脚本,使用systemctl管理Prometheus
[root@prometheus_servers_131 ~]# cat /etc/systemd/system/prometheus-server.service
[Unit]
Description=Linux  Prometheus Server
Documentation=https://prometheus.io/docs/introduction/overview/
After=network.target

[Service]
Restart=on-failure
ExecStart=/zy/app/prometheus-2.53.3.linux-amd64/prometheus    --config.file=/zy/app/prometheus-2.53.3.linux-amd64/prometheus.yml    --web.enable-lifecycle
LimitNOFILE=65535

[Install]
WantedBy=multi-user.target
7.重新加载并开机自启Prometheus
[root@prometheus_servers_131 ~]# systemctl daemon-reload
[root@prometheus_servers_131 ~]# systemctl enable --now prometheus-server
8.验证9090端口是否监听
[root@prometheus_servers_131 ~]# ss -ntl
9. 使用API请求重载(要求启动服务时开启"--web.enable-lifecycle "参数)
[root@prometheus_servers_131 ~]# curl -X POST http://10.0.0.131:9090/-/reload
3.prometheus server监控服务实战
1.监控node-exporter
1.下载node-exporter,注:以下操作均为所有节点需要操作
官方地址:https://prometheus.io/download/#node_exporter
[root@prometheus_nodes_141 ~]# wget https://github.com/prometheus/node_exporter/releases/download/v1.8.2/node_exporter-1.8.2.linux-amd64.tar.gz
2.创建工作目录
[root@prometheus_nodes_141 ~]# mkdir -pv /zy/{app,data,logs}
3.解压软件包
[root@prometheus_nodes_141 ~]# tar xf node_exporter-1.8.2.linux-amd64.tar.gz -C /zy/app/
4.启动服务node_exporter
[root@prometheus_nodes_141 ~]# cd /zy/app/node_exporter-1.8.2.linux-amd64/ && ./node_exporter
5.编写启动脚本,使用systemctl管理node_exporter
[root@prometheus_nodes_141 ~]# cat /etc/systemd/system/node-exporter.service
[Unit]
Description=Linux Node Exporter
Documentation=https://prometheus.io/docs/introduction/overview/
After=network.target

[Service]
ExecStart=/zy/app/node_exporter-1.8.2.linux-amd64/node_exporter

[Install]
WantedBy=multi-user.target
6.将服务设置为开机自启动
[root@prometheus_nodes_141 ~]# systemctl daemon-reload
[root@prometheus_nodes_141 ~]# systemctl enable --now node-exporter.service
2.Prometheus配置监控node-exporter
1.修改Prometheus配置文件
[root@prometheus_servers_131 ~]# vim /zy/app/prometheus-2.53.3.linux-amd64/prometheus.yml
...
global:
  # prometheus server采集数据的间隔时间
  scrape_interval: 3s
...
scrape_configs:
  ...
    # 指定任务的名称
  - job_name: "node-exporter"
    # 指定静态配置
    static_configs:
      # - targets: ["10.0.0.141:9100","10.0.0.142:9100"]
      - targets:
          - "10.0.0.141:9100"
          - "10.0.0.142:9100"
          - "10.0.0.143:9100"

2. 重新加载配置文件,也可以直接重启服务
[root@prometheus_servers_131 ~]# curl -X POST http://10.0.0.131:9090/-/reload
[root@prometheus_servers_131 ~]# systemctl restart prometheus-server

3.访问服务端9090端口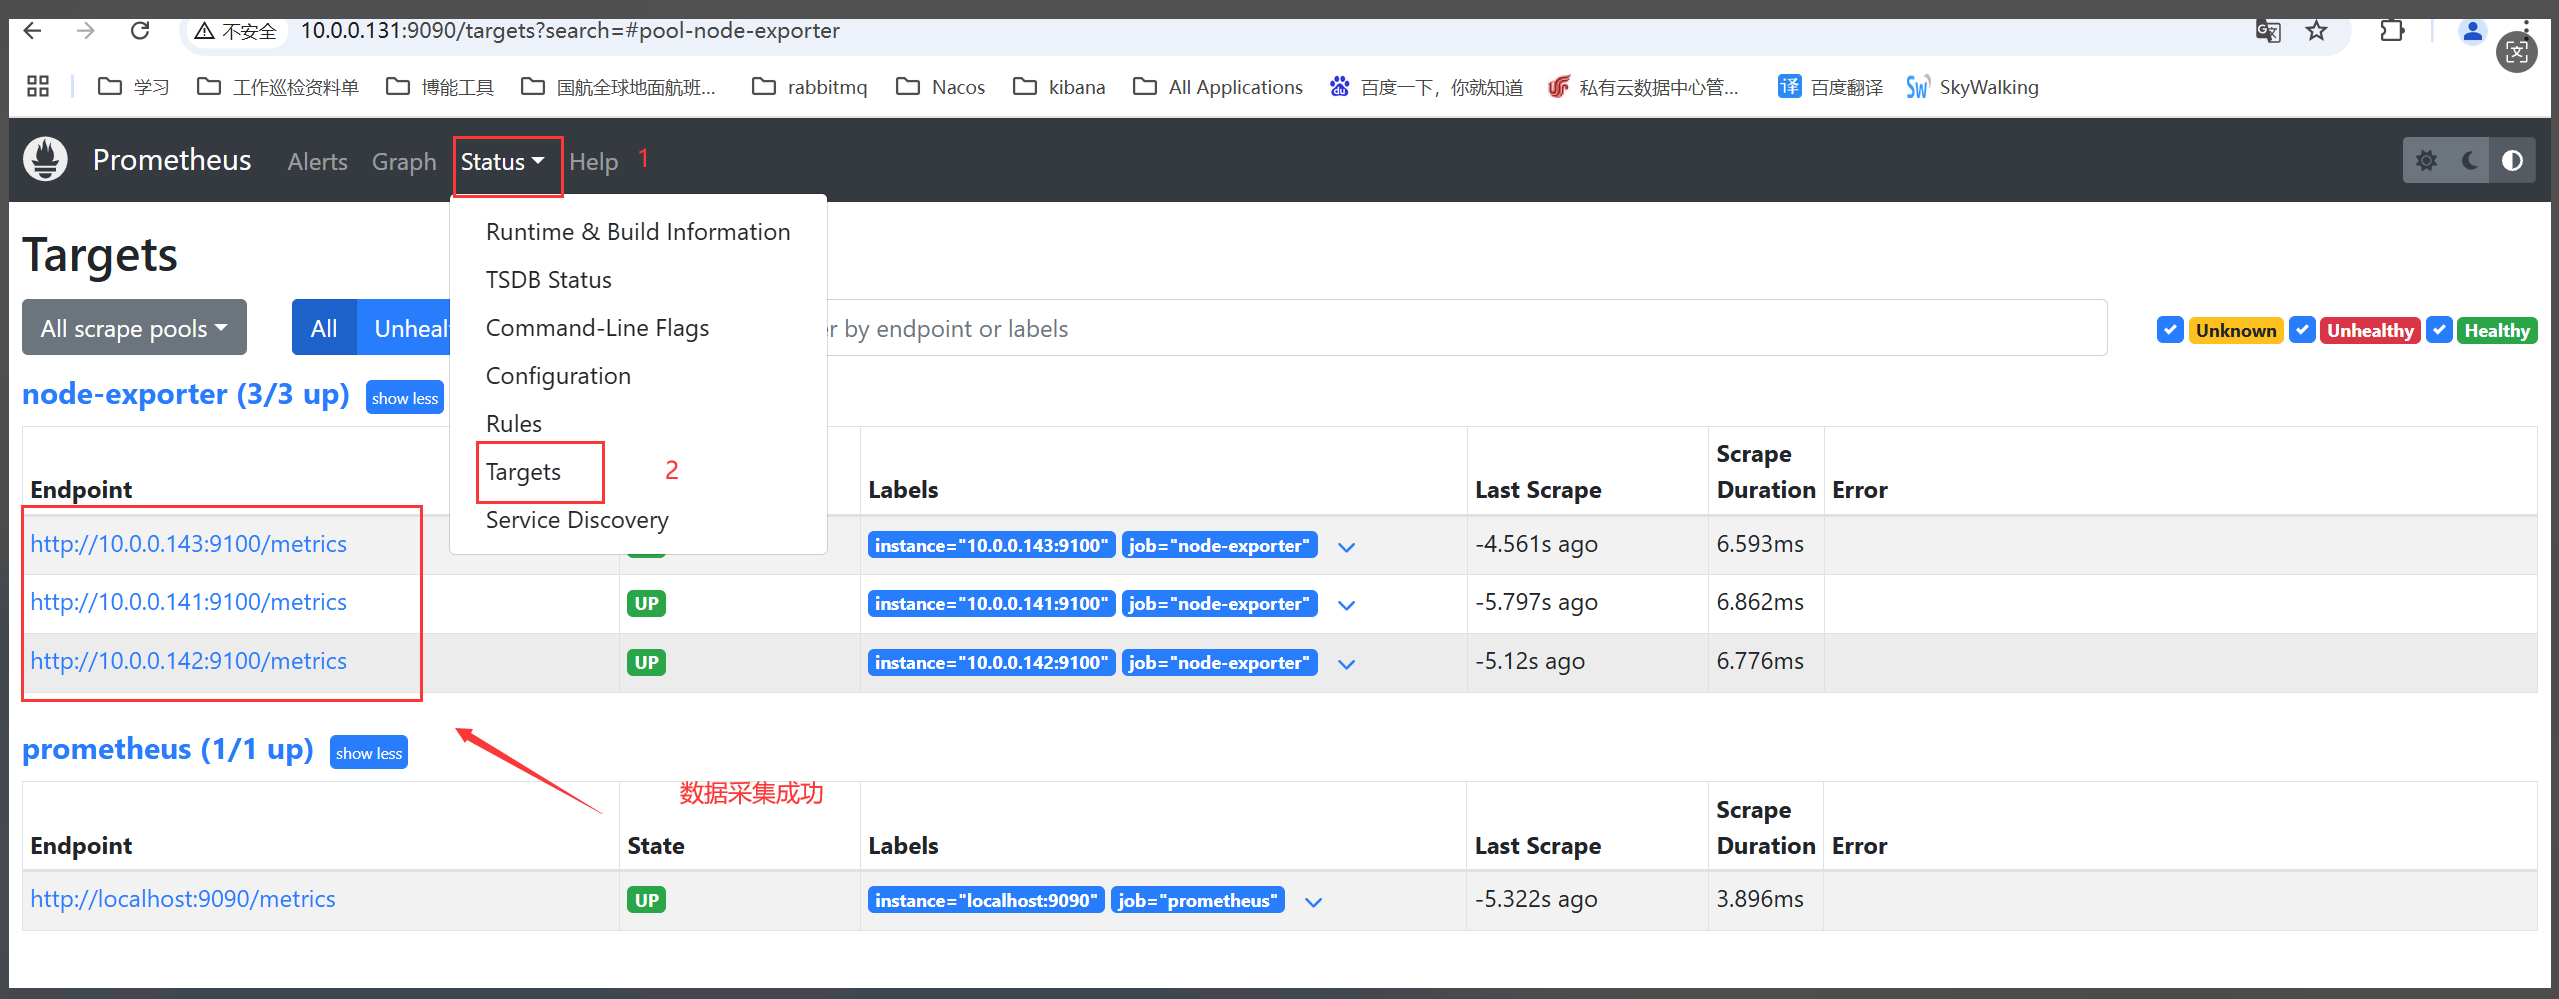
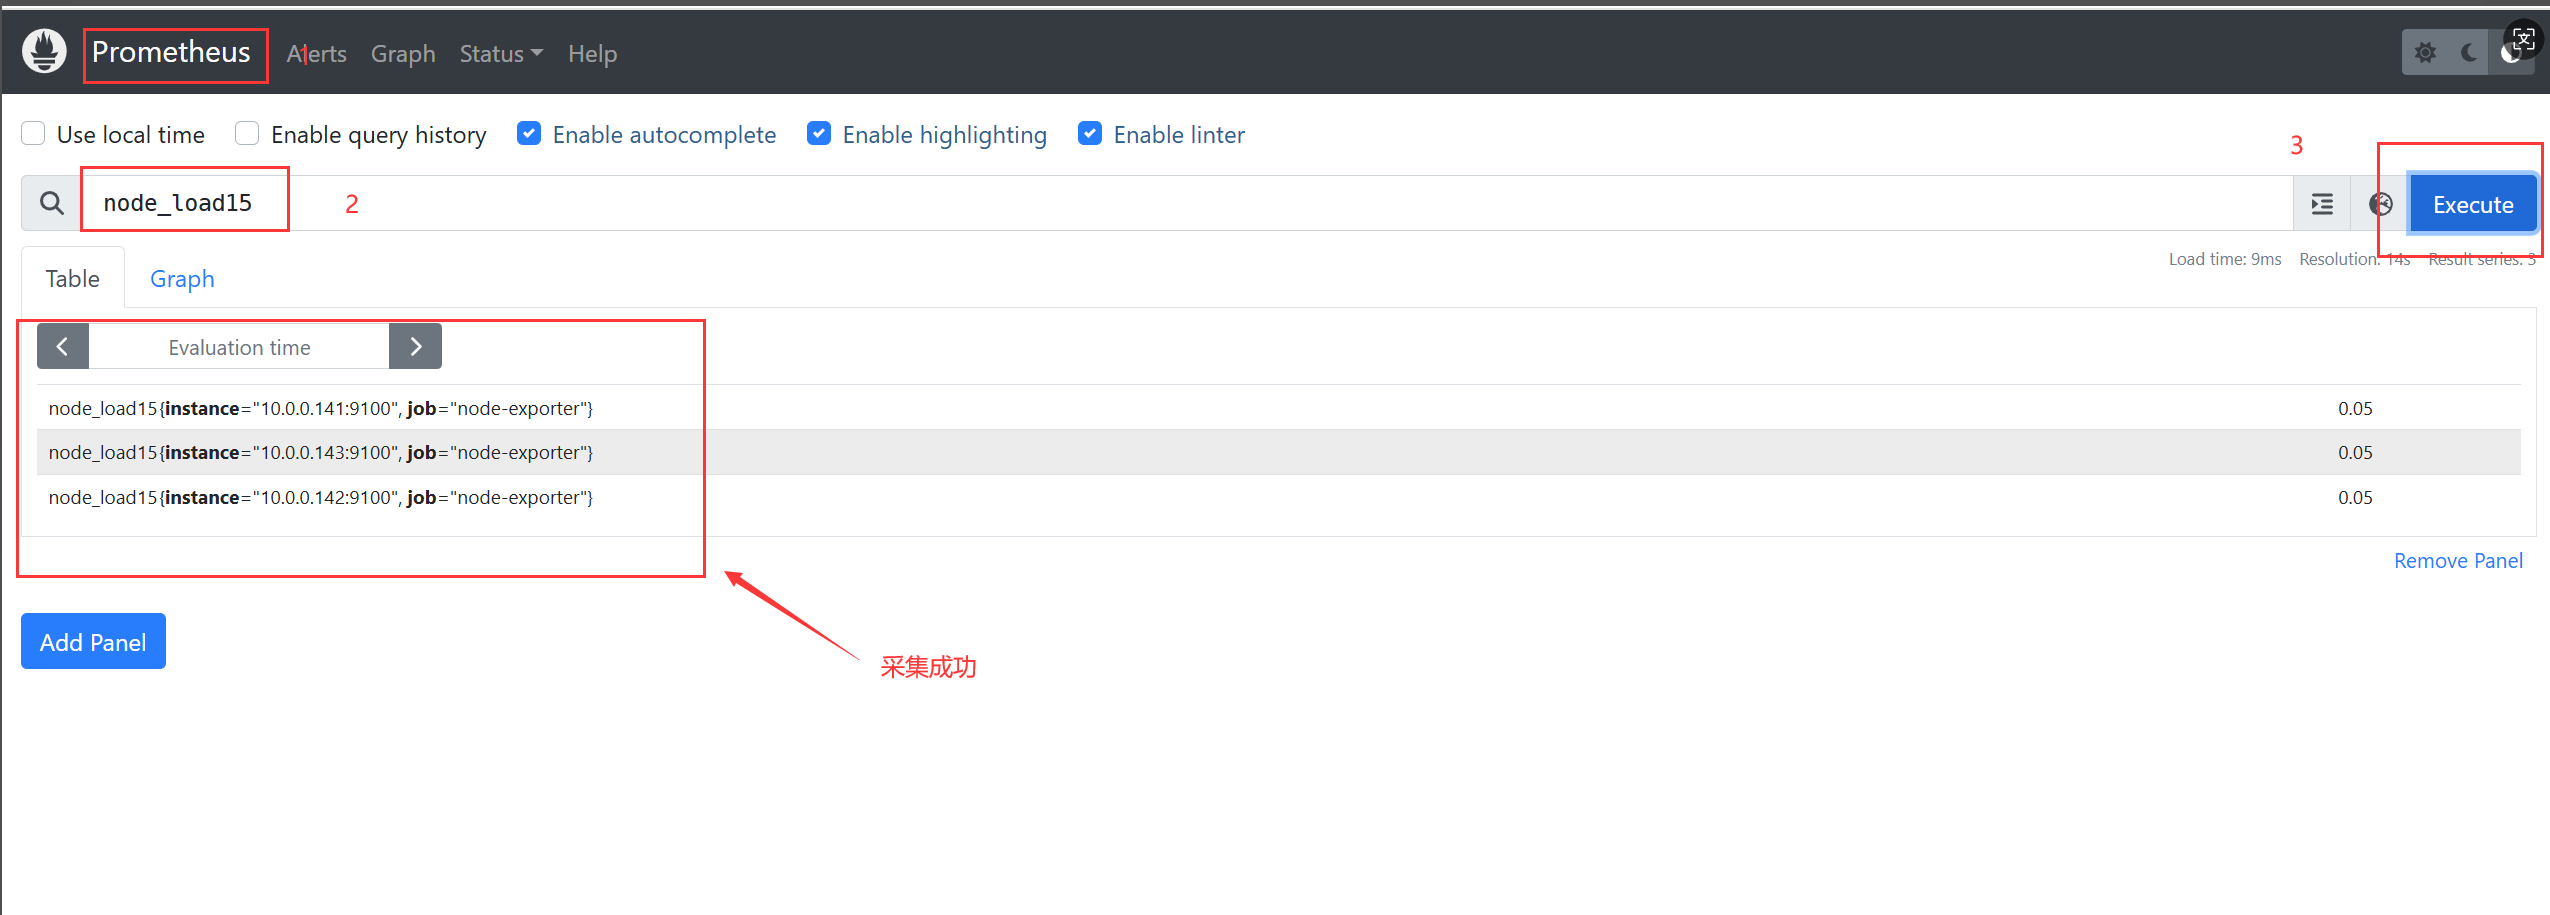
3.Prom QL语句
prometheus监控中采集过来的数据统一称为Metrics数据,其并不是代表具体的数据格式,而是一种统计度量计算单位。

当我们需要为某个系统或者某个服务做监控是,就需要使用到metrics。

prometheus支持的metrics包括但不限于以下几种数据类型:
    guage:
        最简单的度量指标,只是一个简单的返回值,或者叫瞬时状态。
        比如说统计硬盘,内存等使用情况。

    couter:
        就是一个计数器,从数据量0开始累积计算,在理想情况下,只能是永远的增长,不会降低(有特殊情况,比如粉丝量)。
        比如统计1小时,1天,1周,1一个月的用户访问量,这就是一个累加的操作。

    histograms:
        是统计数据的分布情况,比如最小值,最大值,中间值,中位数等,代表的是一种近似百分比估算数值。
        通过histograms可以分别统计处在一个时间段(1s,2s,5s,10s)内nginx访问用户的响应时间。

    summary:
        summary是histograms的扩展类型,主要弥补histograms不足。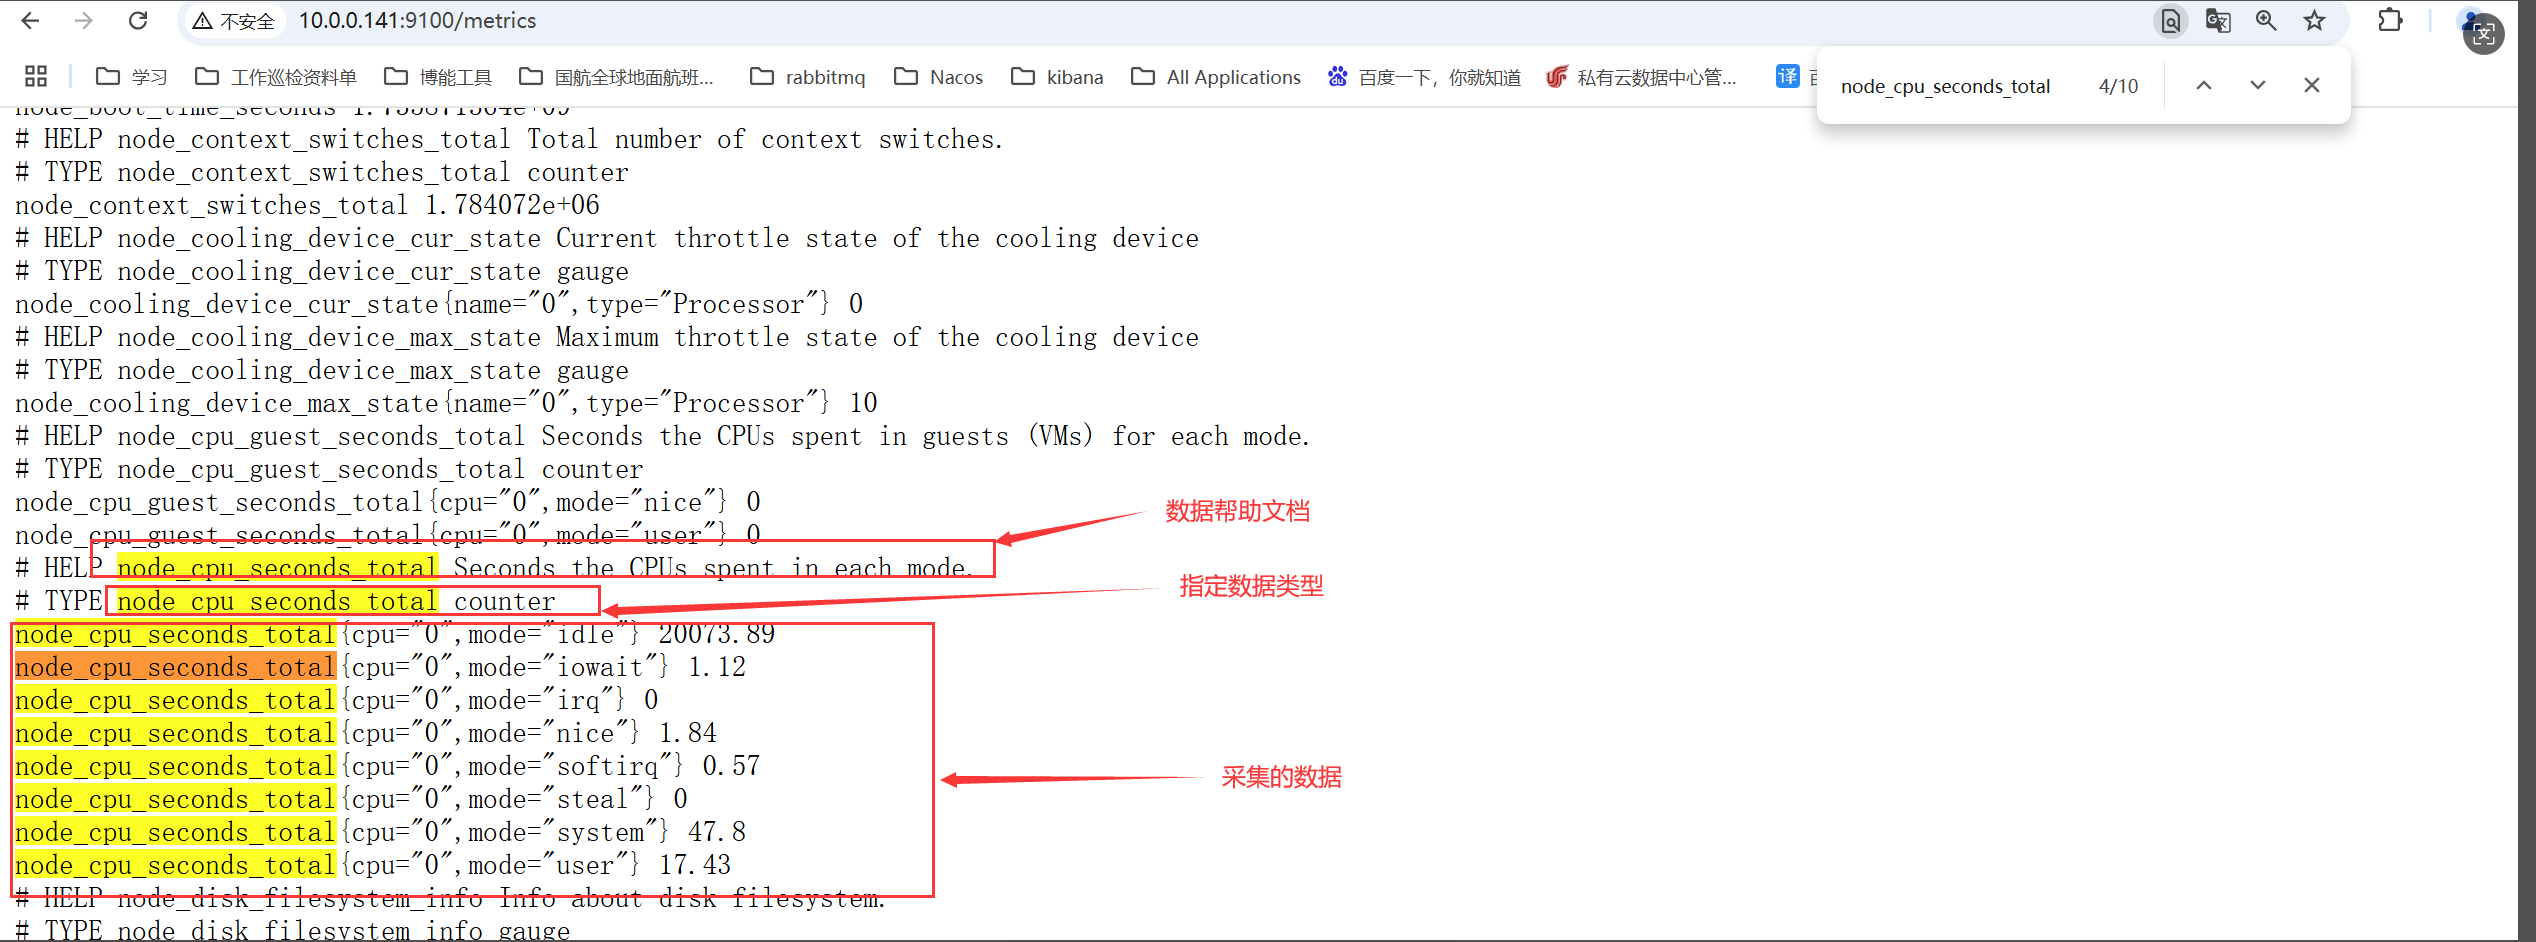
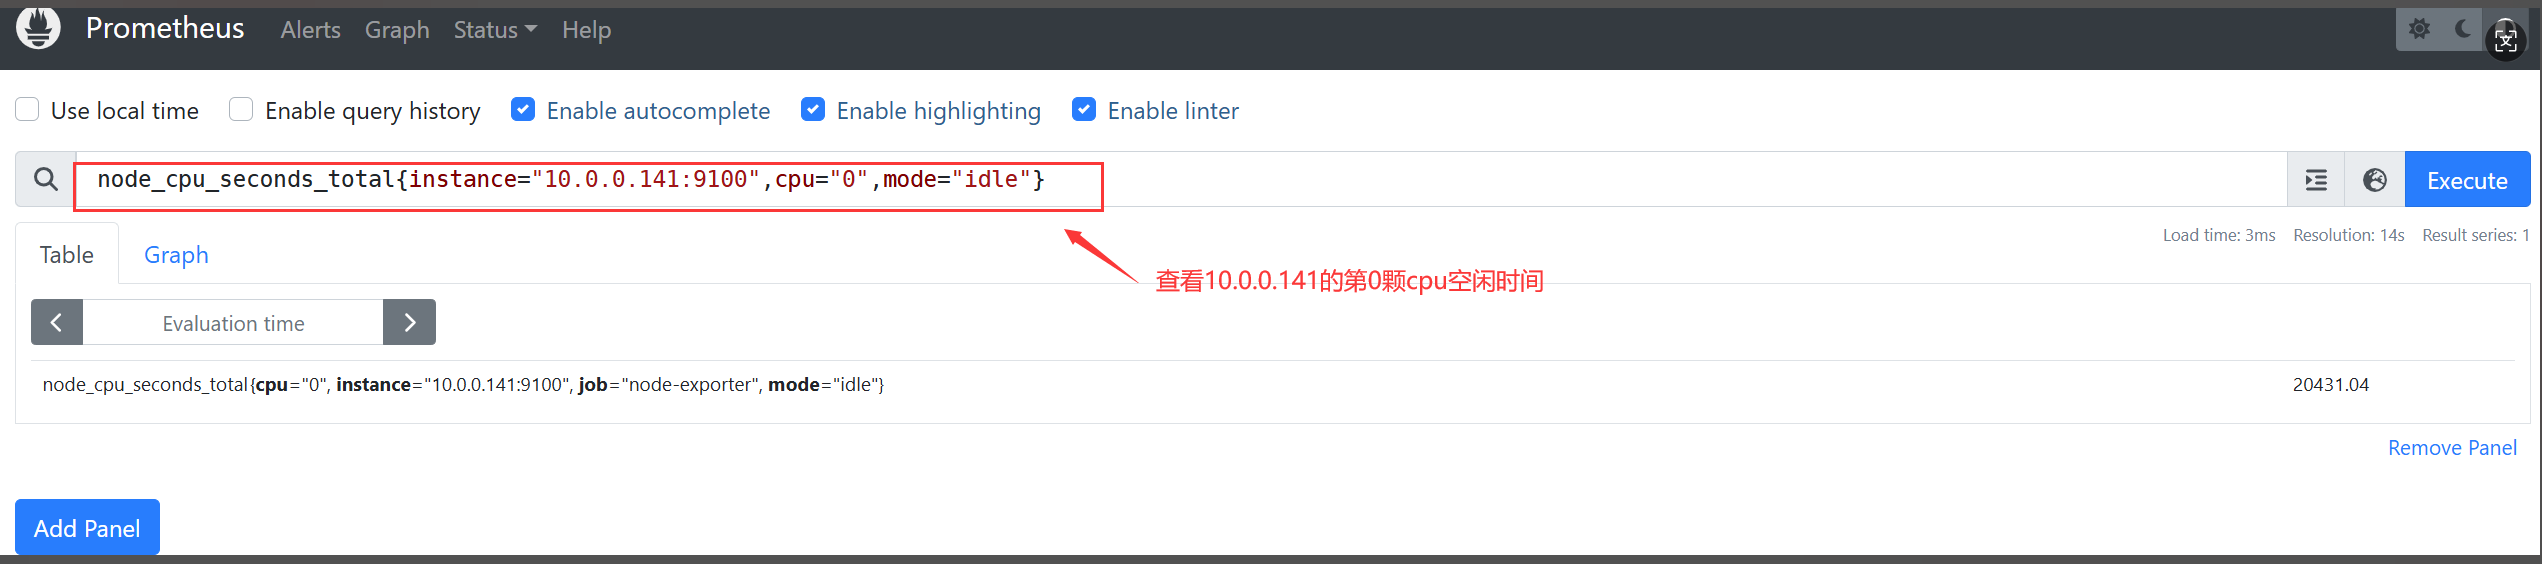
PromQL初体验
1.查看某个特定的key
node_cpu_seconds_total
2.查看某个节点的指标
node_cpu_seconds_total{instance="10.0.0.141:9100"}
3.查看某个节点的某刻CPU的某种状态
node_cpu_seconds_total{instance="10.0.0.141:9100",cpu="0",mode="idle"}
4.查询最近10s内某个节点CPU的某种状态时间
node_cpu_seconds_total{instance="10.0.0.141:9100",cpu="0",mode="idle"}[10s]
5.统计1分钟内,使用标签过滤器查看"10.0.0.142:9100"节点的第0颗CPU,非空闲状态使用的总时间
node_cpu_seconds_total{mode!="idle",cpu="0", instance="10.0.0.142:9100"}[1m]
6.统计1分钟内,使用标签过滤器查看"10.0.0.142:9100"节点的第0颗CPU,mode名称以字母"i"开头的所有CPU核心。
node_cpu_seconds_total{mode=~"i.*",cpu="0", instance="10.0.0.142:9100"}[1m]
4.Prometheus常用的函数
1.increase
increase函数:
    用来针对counter数据类型,截取其中一段时间总的增量。

举个例子:
    increase(node_cpu_seconds_total{mode="idle",cpu="0", instance="10.0.0.42:9100"}[1m])
        统计1分钟内,使用标签过滤器查看"10.0.0.42:9100"节点的第0颗CPU,空闲状态使用的总时间增量。

2. sum
sum函数:
    加和的作用。

举个例子:
 sum(increase(node_cpu_seconds_total{mode="idle",cpu="0"}[1m]))
        统计1分钟内,使用标签过滤器查看所有节点的第0颗CPU,空闲状态使用的总时间增量,并将返回结果累加。

3.by
by函数:
    将数据进行分组,类似于MySQL的"GROUP BY"。

举个例子:
    sum(increase(node_cpu_seconds_total{mode="idle",cpu="0"}[1m])) by (instance)
        统计1分钟内,使用标签过滤器查看第0颗CPU空闲状态,并将结果进行累加,基于instance进行分组。

4.rate
rate函数:
    它的功能是按照设置的时间段,取counter在这个时间段中平均每秒的增量。


举个例子:
    rate(node_cpu_seconds_total{mode="idle",cpu="0", instance="10.0.0.42:9100"}[1m])
        统计1分钟内,使用标签过滤器查看"10.0.0.42:9100"节点的第0颗CPU,空闲状态使用的每秒的增量。

5.topk
topk函数:
    取前几位的最高值,实际使用的时候一般会用该函数进行瞬时报警,而不是为了观察曲线图。

举个例子:
    topk(3, rate(node_cpu_seconds_total{mode="idle",cpu="0"}[1m]))
        统计1分钟内,使用标签过滤器查看第0颗CPU,所有状态使用的每秒的增量,只查看前3个节点。

6.count
count函数:
    把数值符合条件的,输出数目进行累加加和,一般用它进行一些某户的监控判断。
    比如说企业中有100台服务器,如果只有10台服务器CPU使用率高于80%时候是不需要报警的,但是数量操作70台时就需要报警了。

举个例子:
    count(oldboyedu_tcp_wait_conn > 500):
        假设oldboyedu_tcp_wait_conn是咱们自定义的KEY。
        若TCP等待数量大于500的机器数量就判断条件为真。

    count(rate(node_cpu_seconds_total{cpu="0",mode="idle"}[1m]))
        对统计的结果进行计数。

7.其他函数:
推荐阅读:
    https://prometheus.io/docs/prometheus/latest/querying/functions/
4.使用grafana展示数据
grafana简介
    grafana是一个图形化展示工具,可以直接连接prometheus server,支持基于PromQL语法进行数据查询。

    下载地址:
        https://grafana.com/grafana/download
1.下载grafana
[root@grafana71 ~]# yum install -y https://dl.grafana.com/enterprise/release/grafana-enterprise-11.4.0-1.x86_64.rpm
2. 启动grafana
[root@grafana71 ~]# systemctl enable --now grafana-server1。访问grafana的WebUI
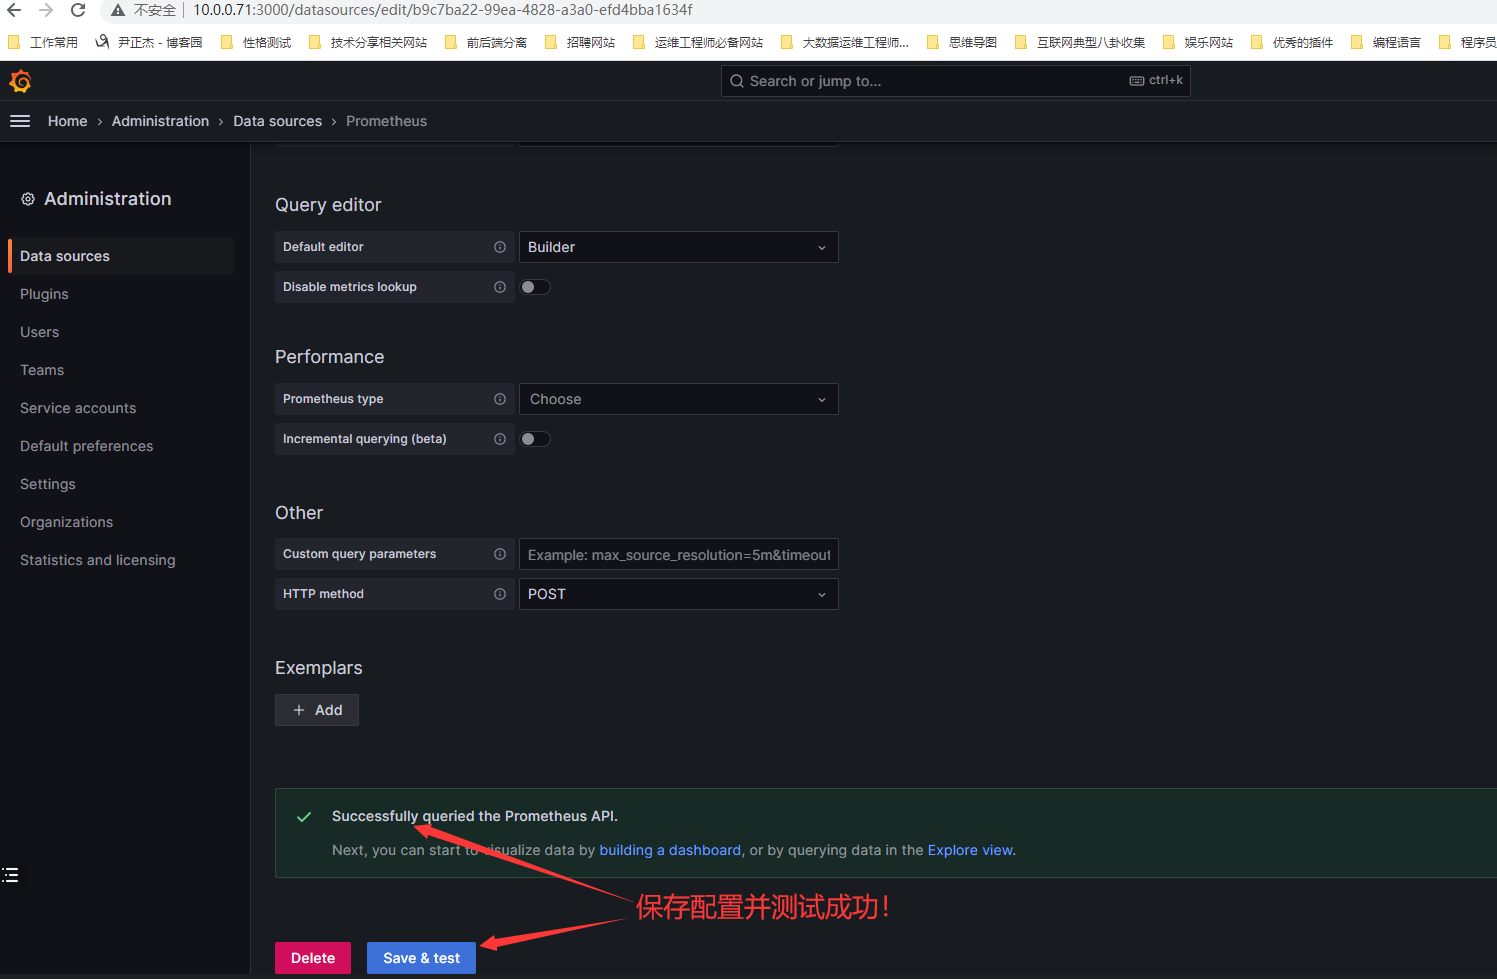
2.配置grafana的数据源为prometheus
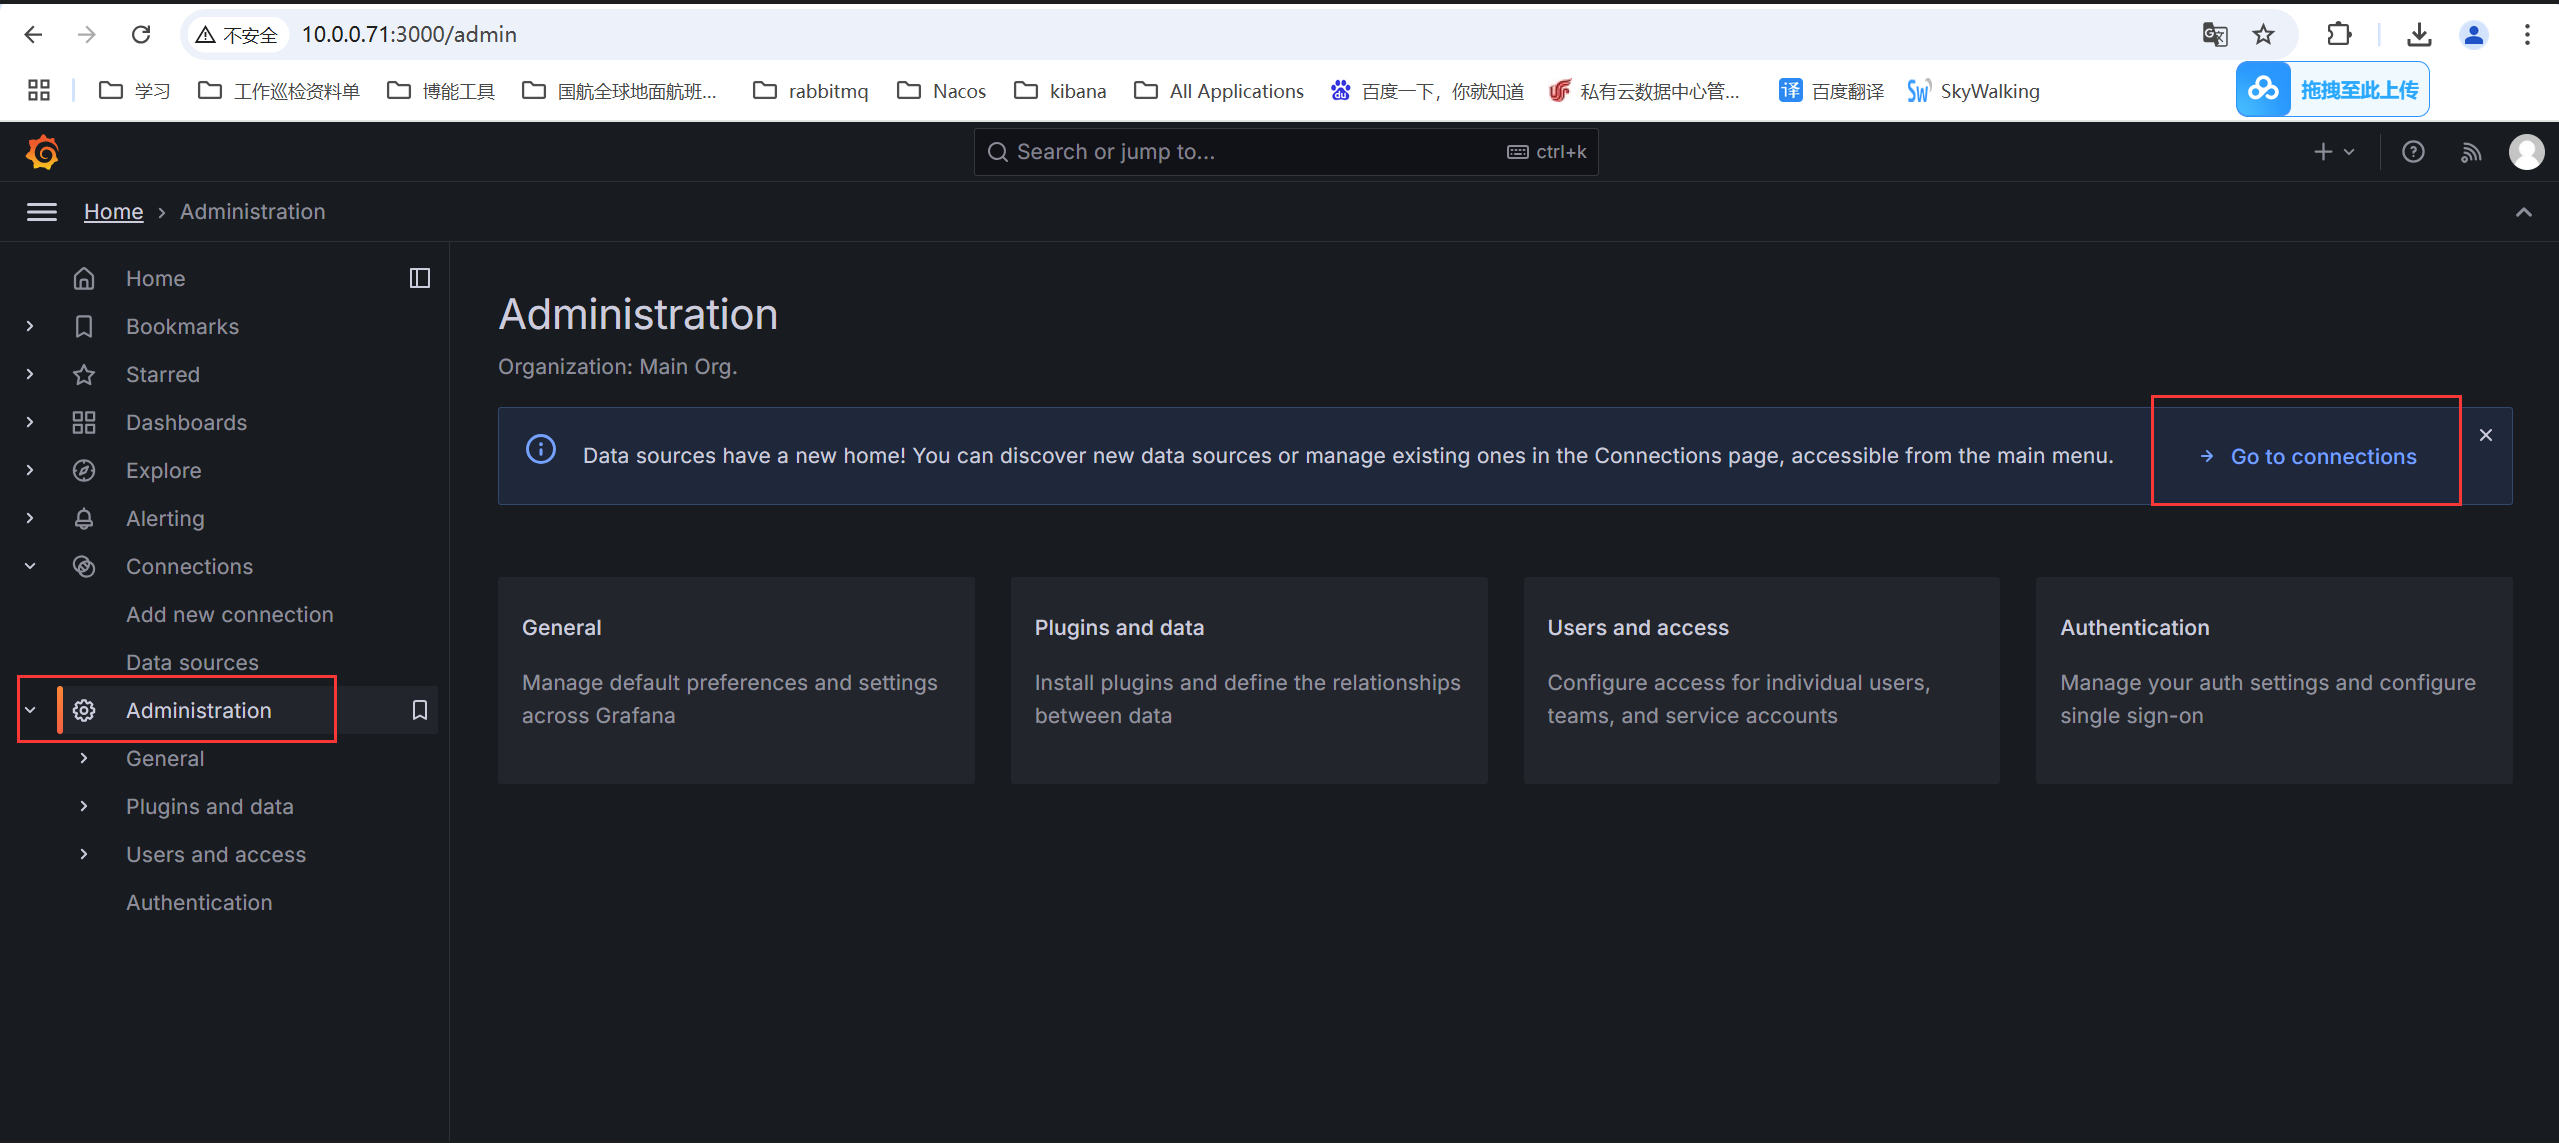
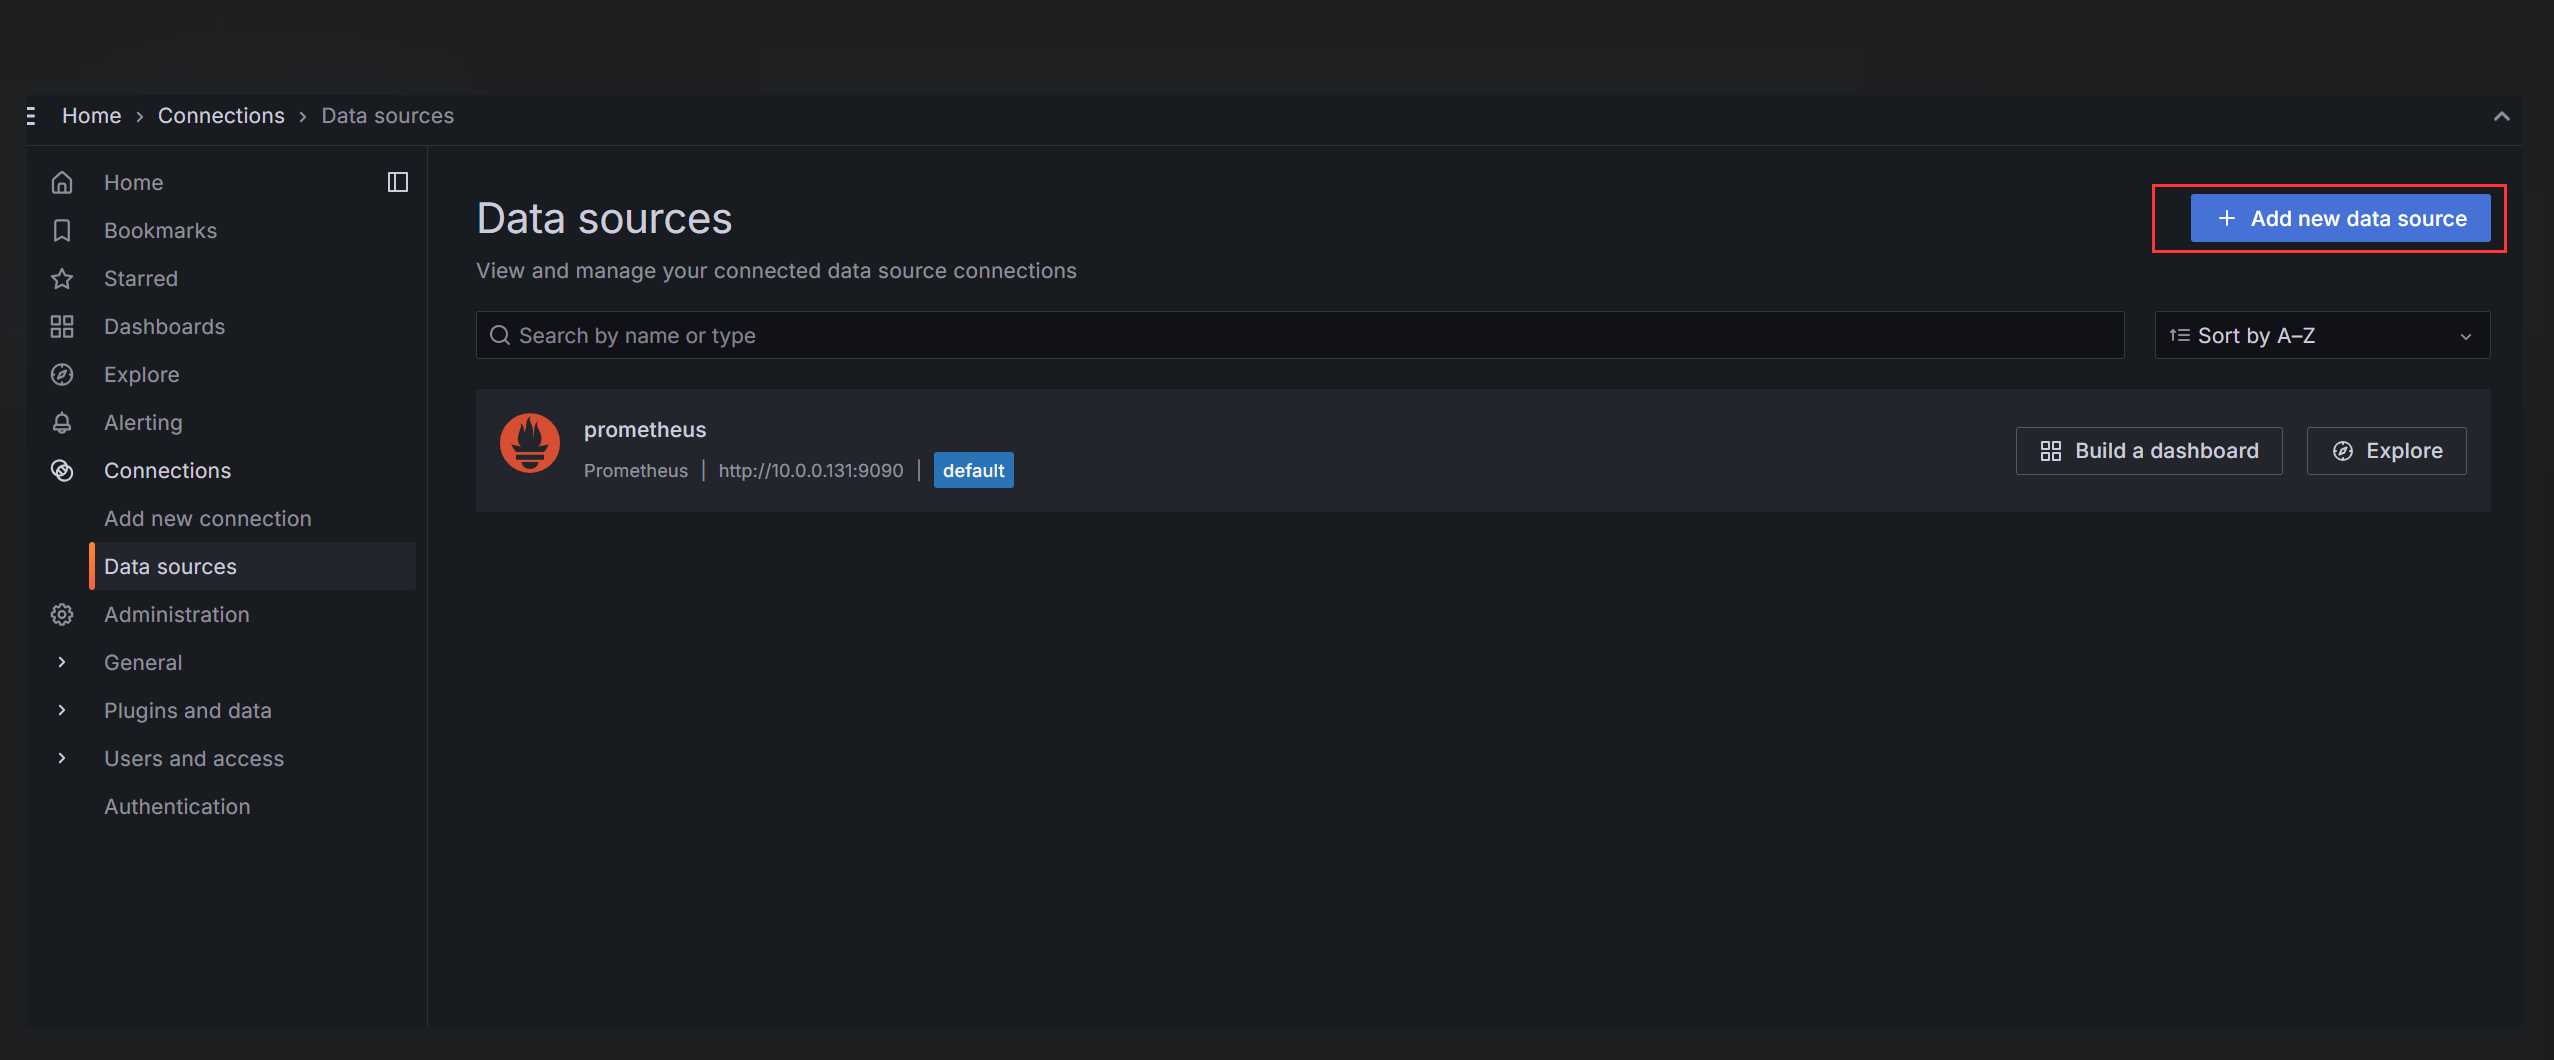
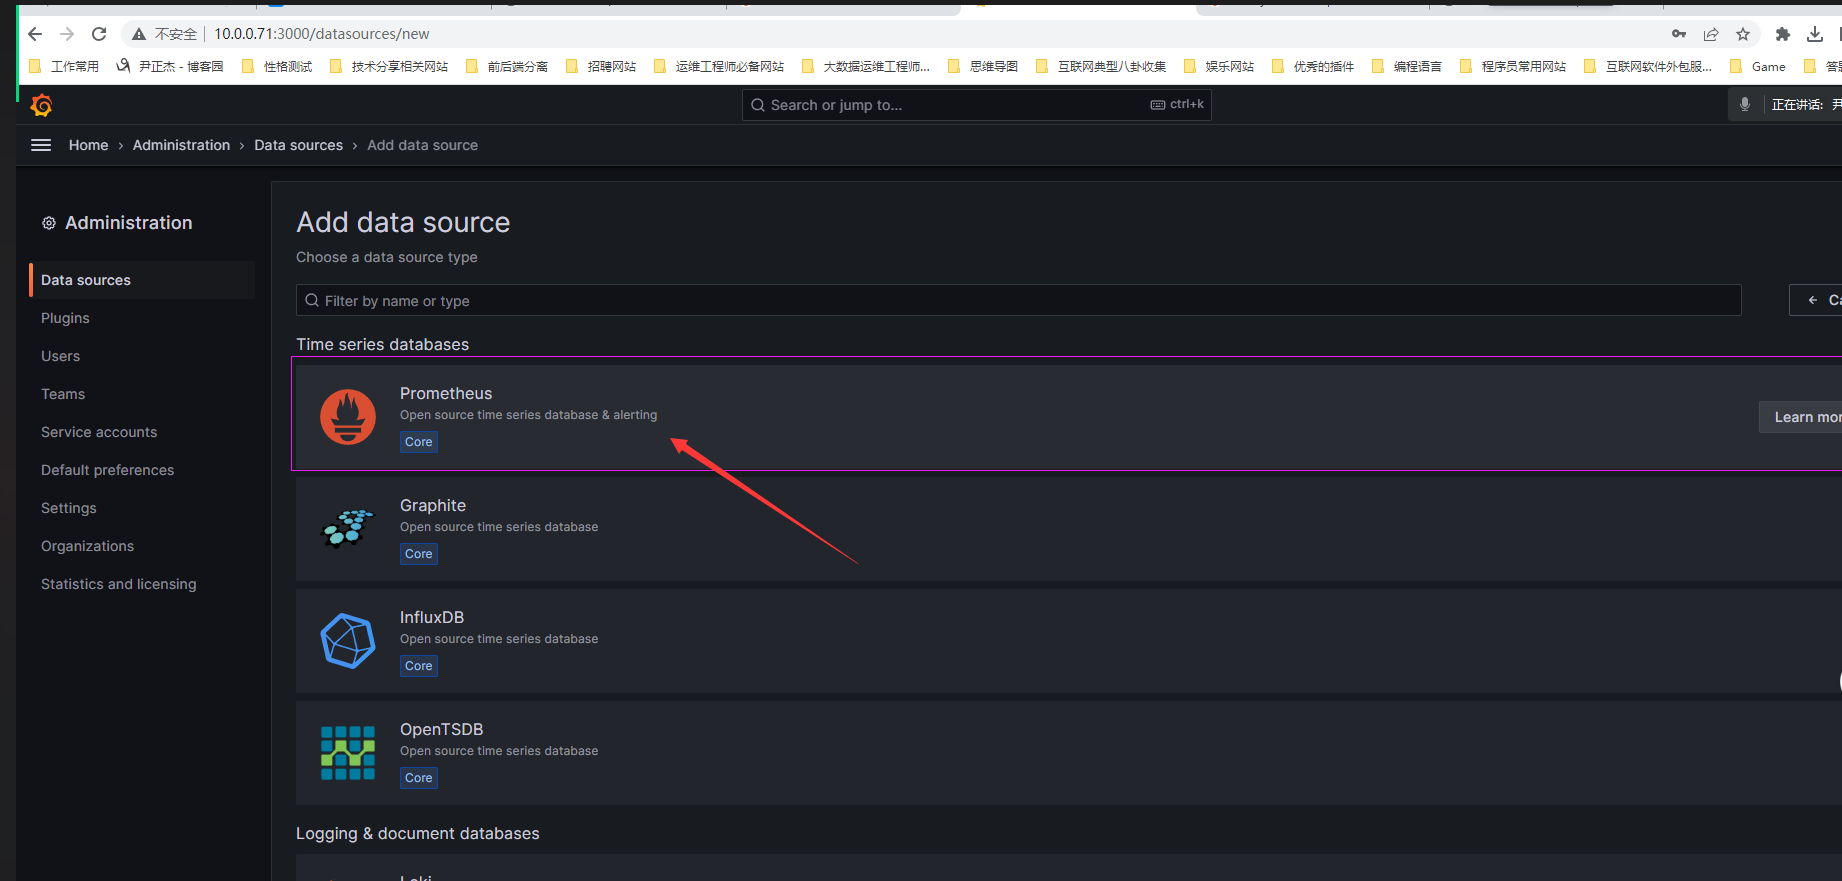
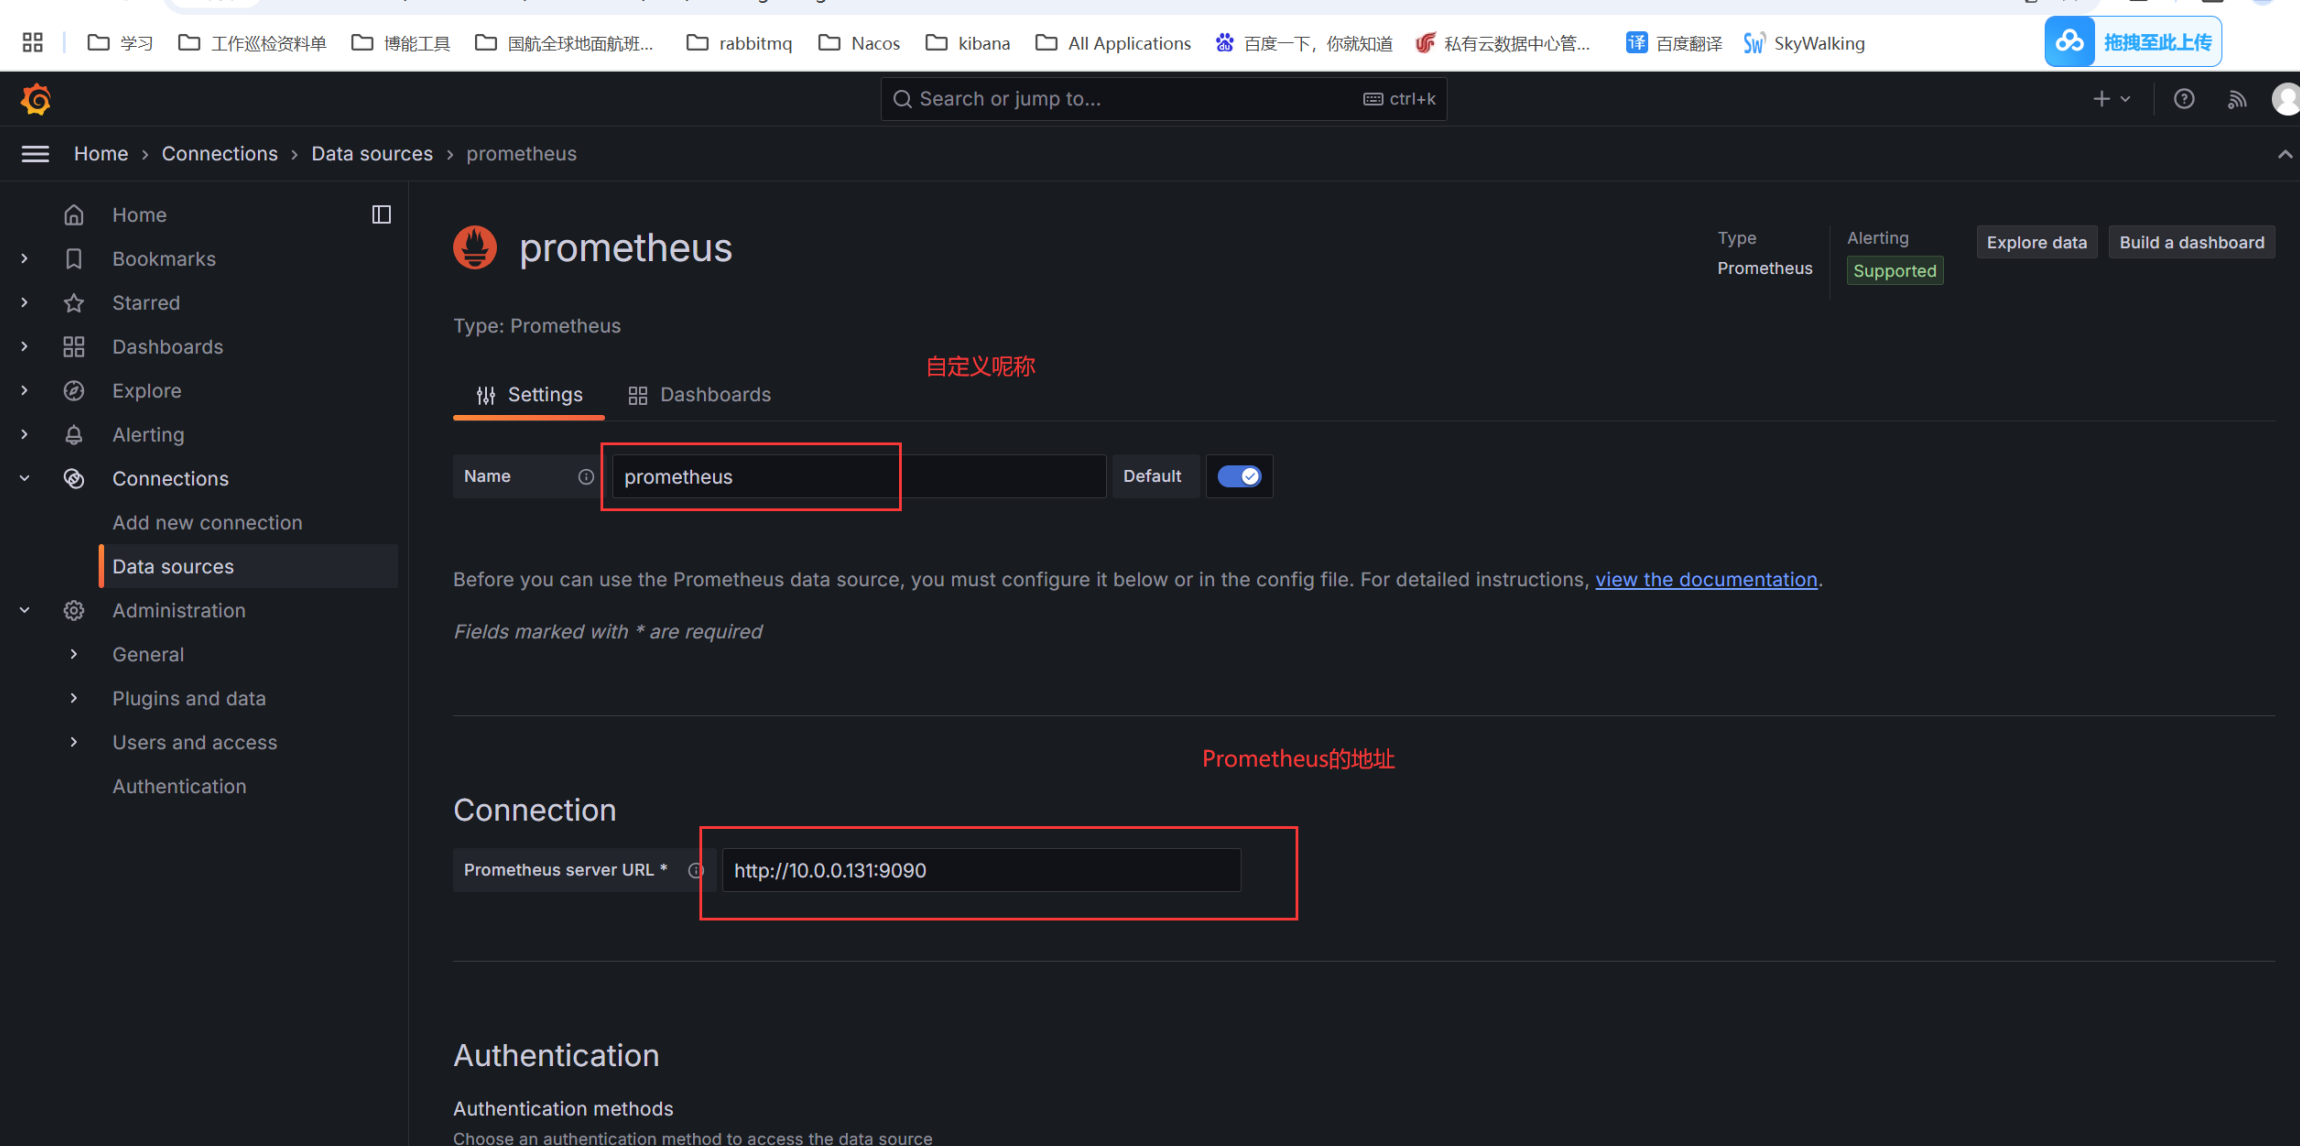
3.保存测试成功
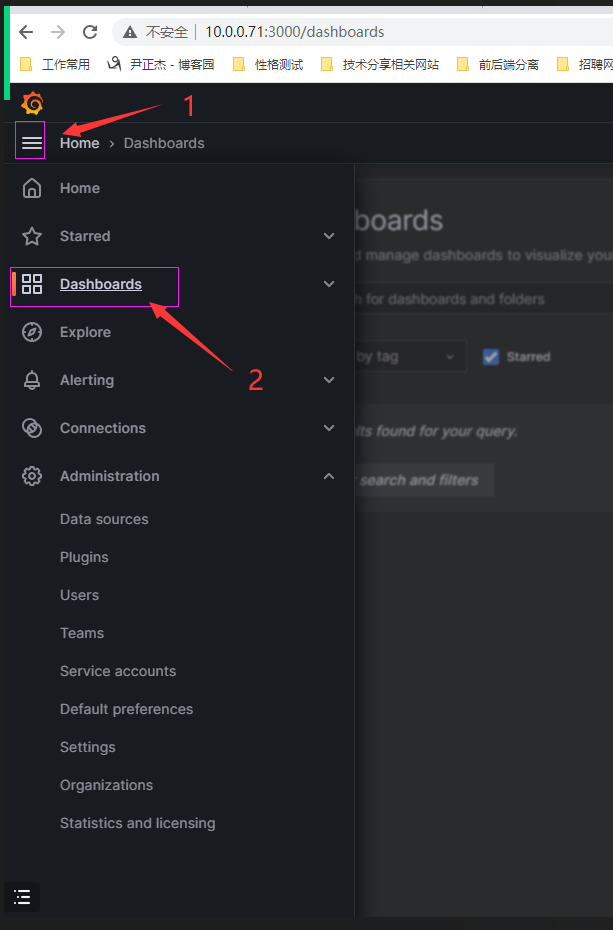
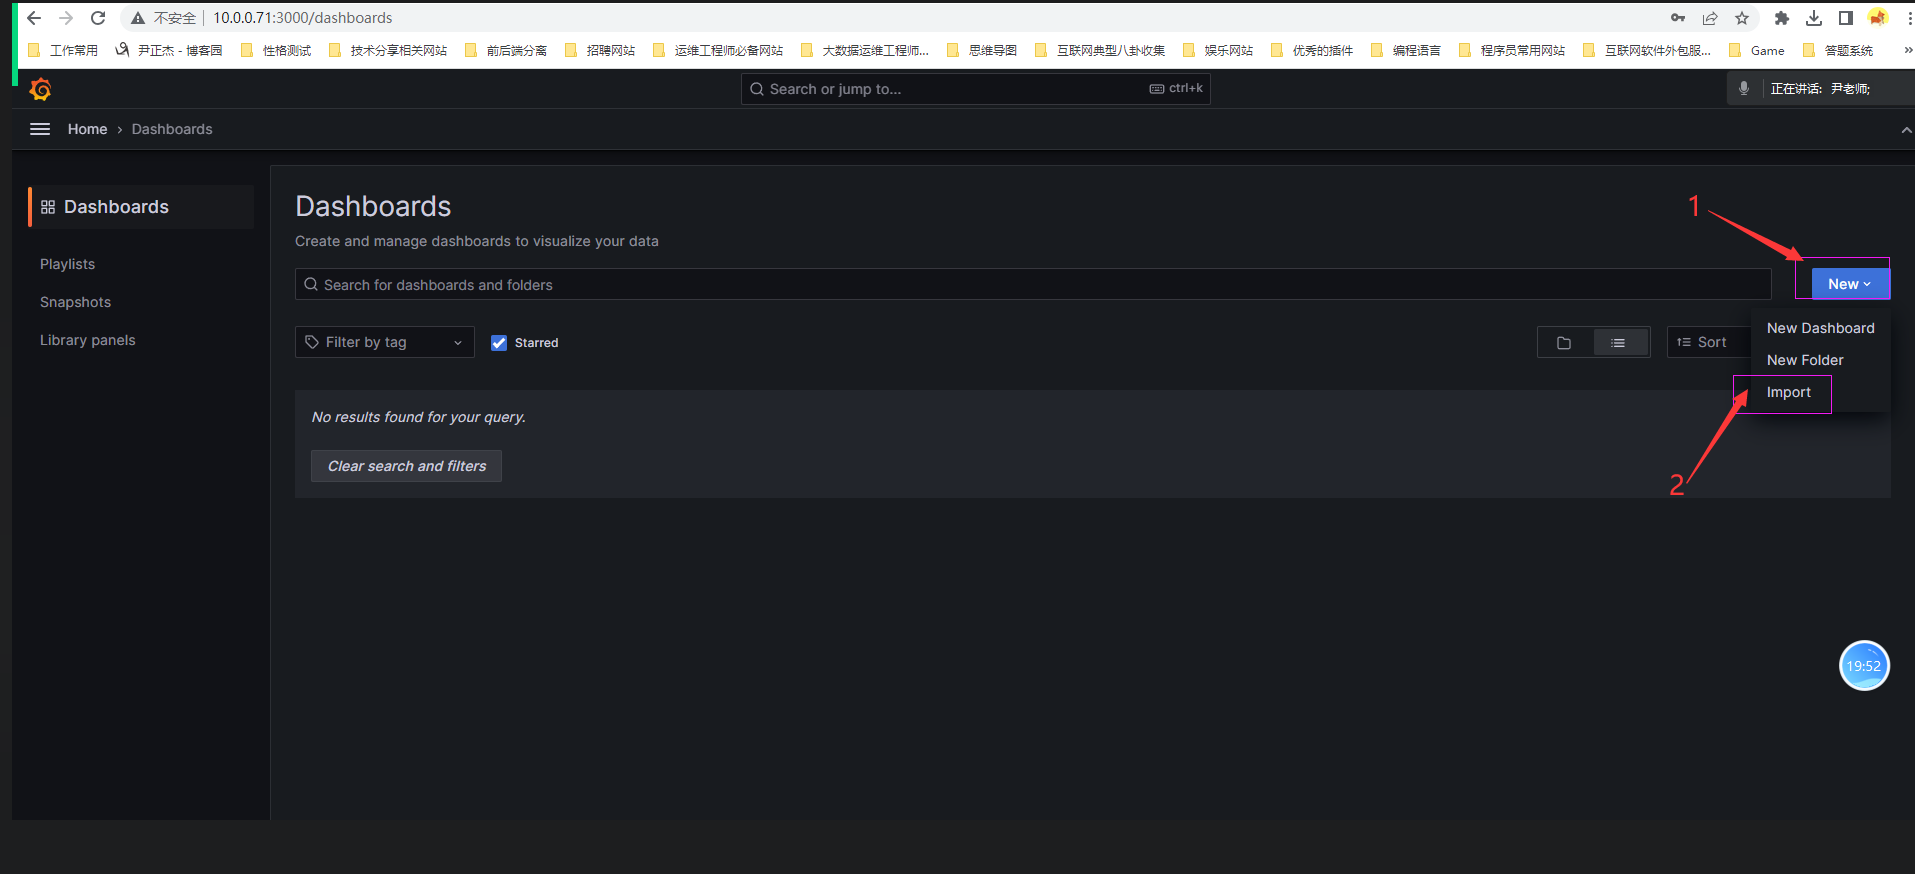
4.部署grafana并导入node-exporter模板
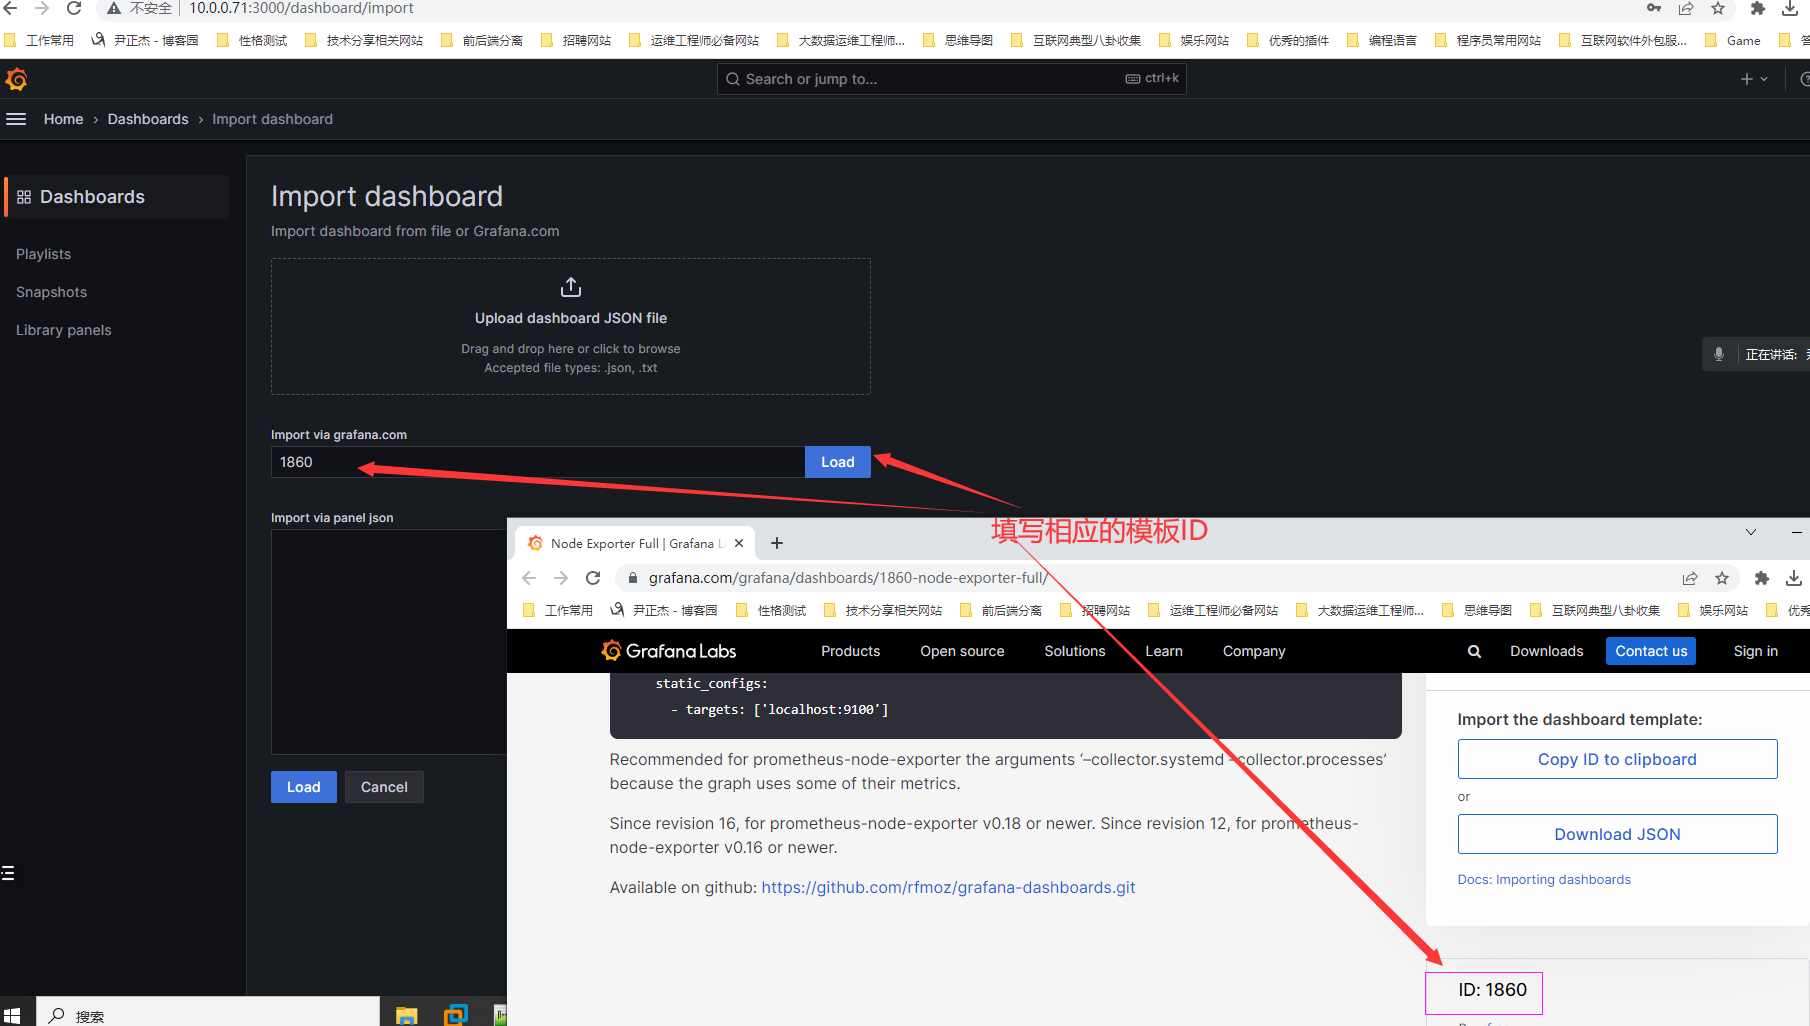
5. grafana官网查询dashboard模板id
https://grafana.com/grafana/dashboards
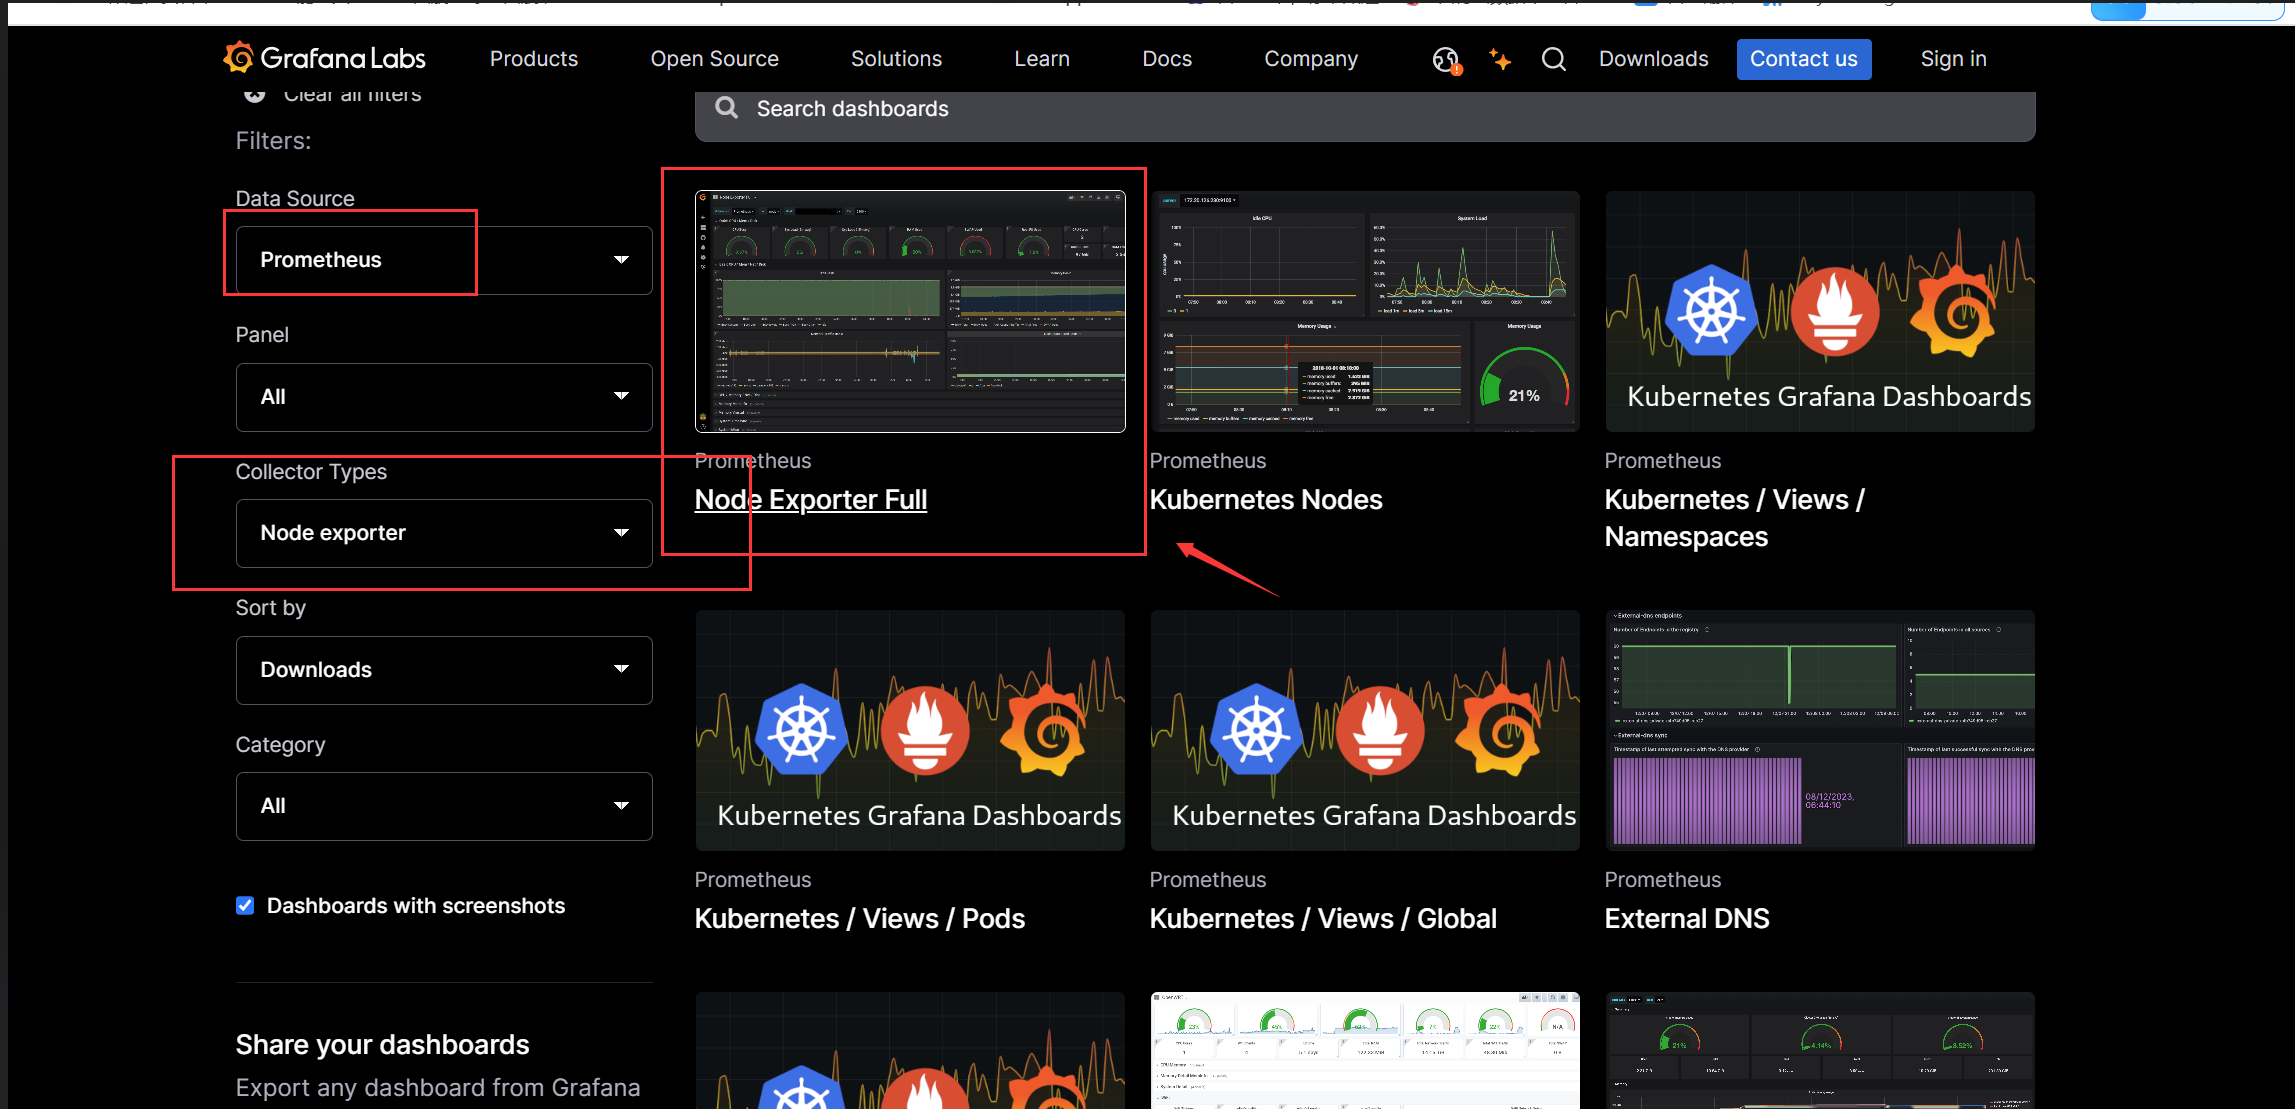
6.选择相应的模板ID
1860
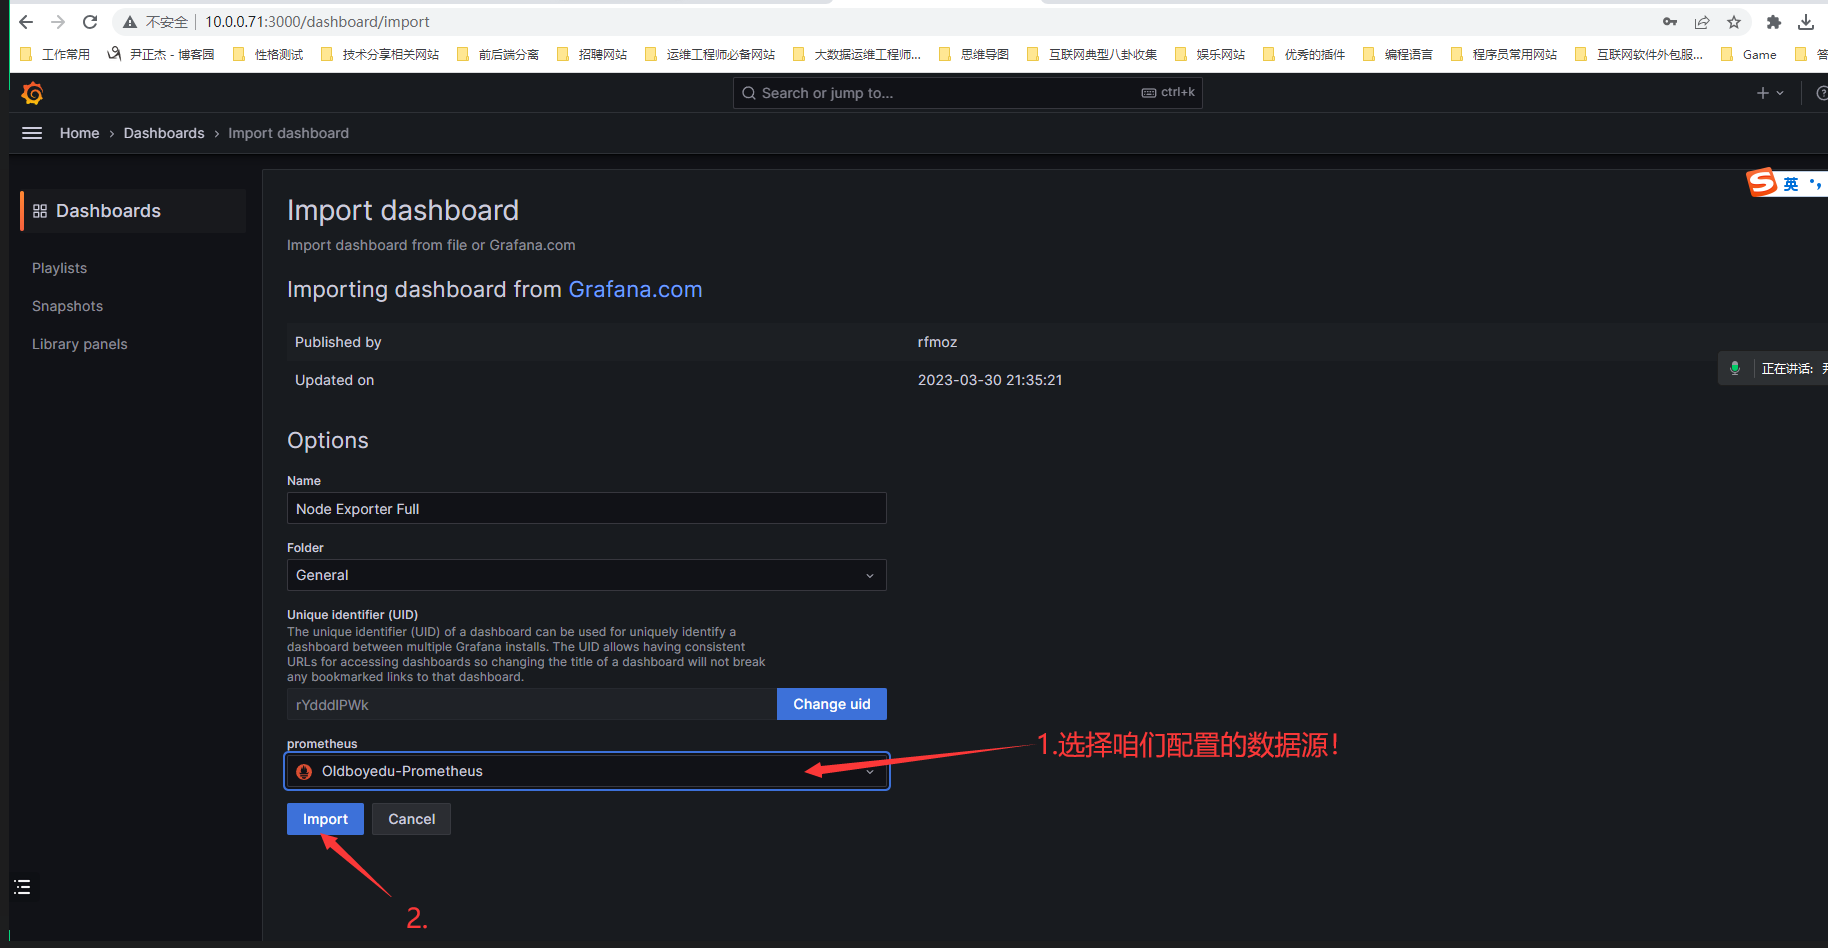
7.选择应用模板的数据源
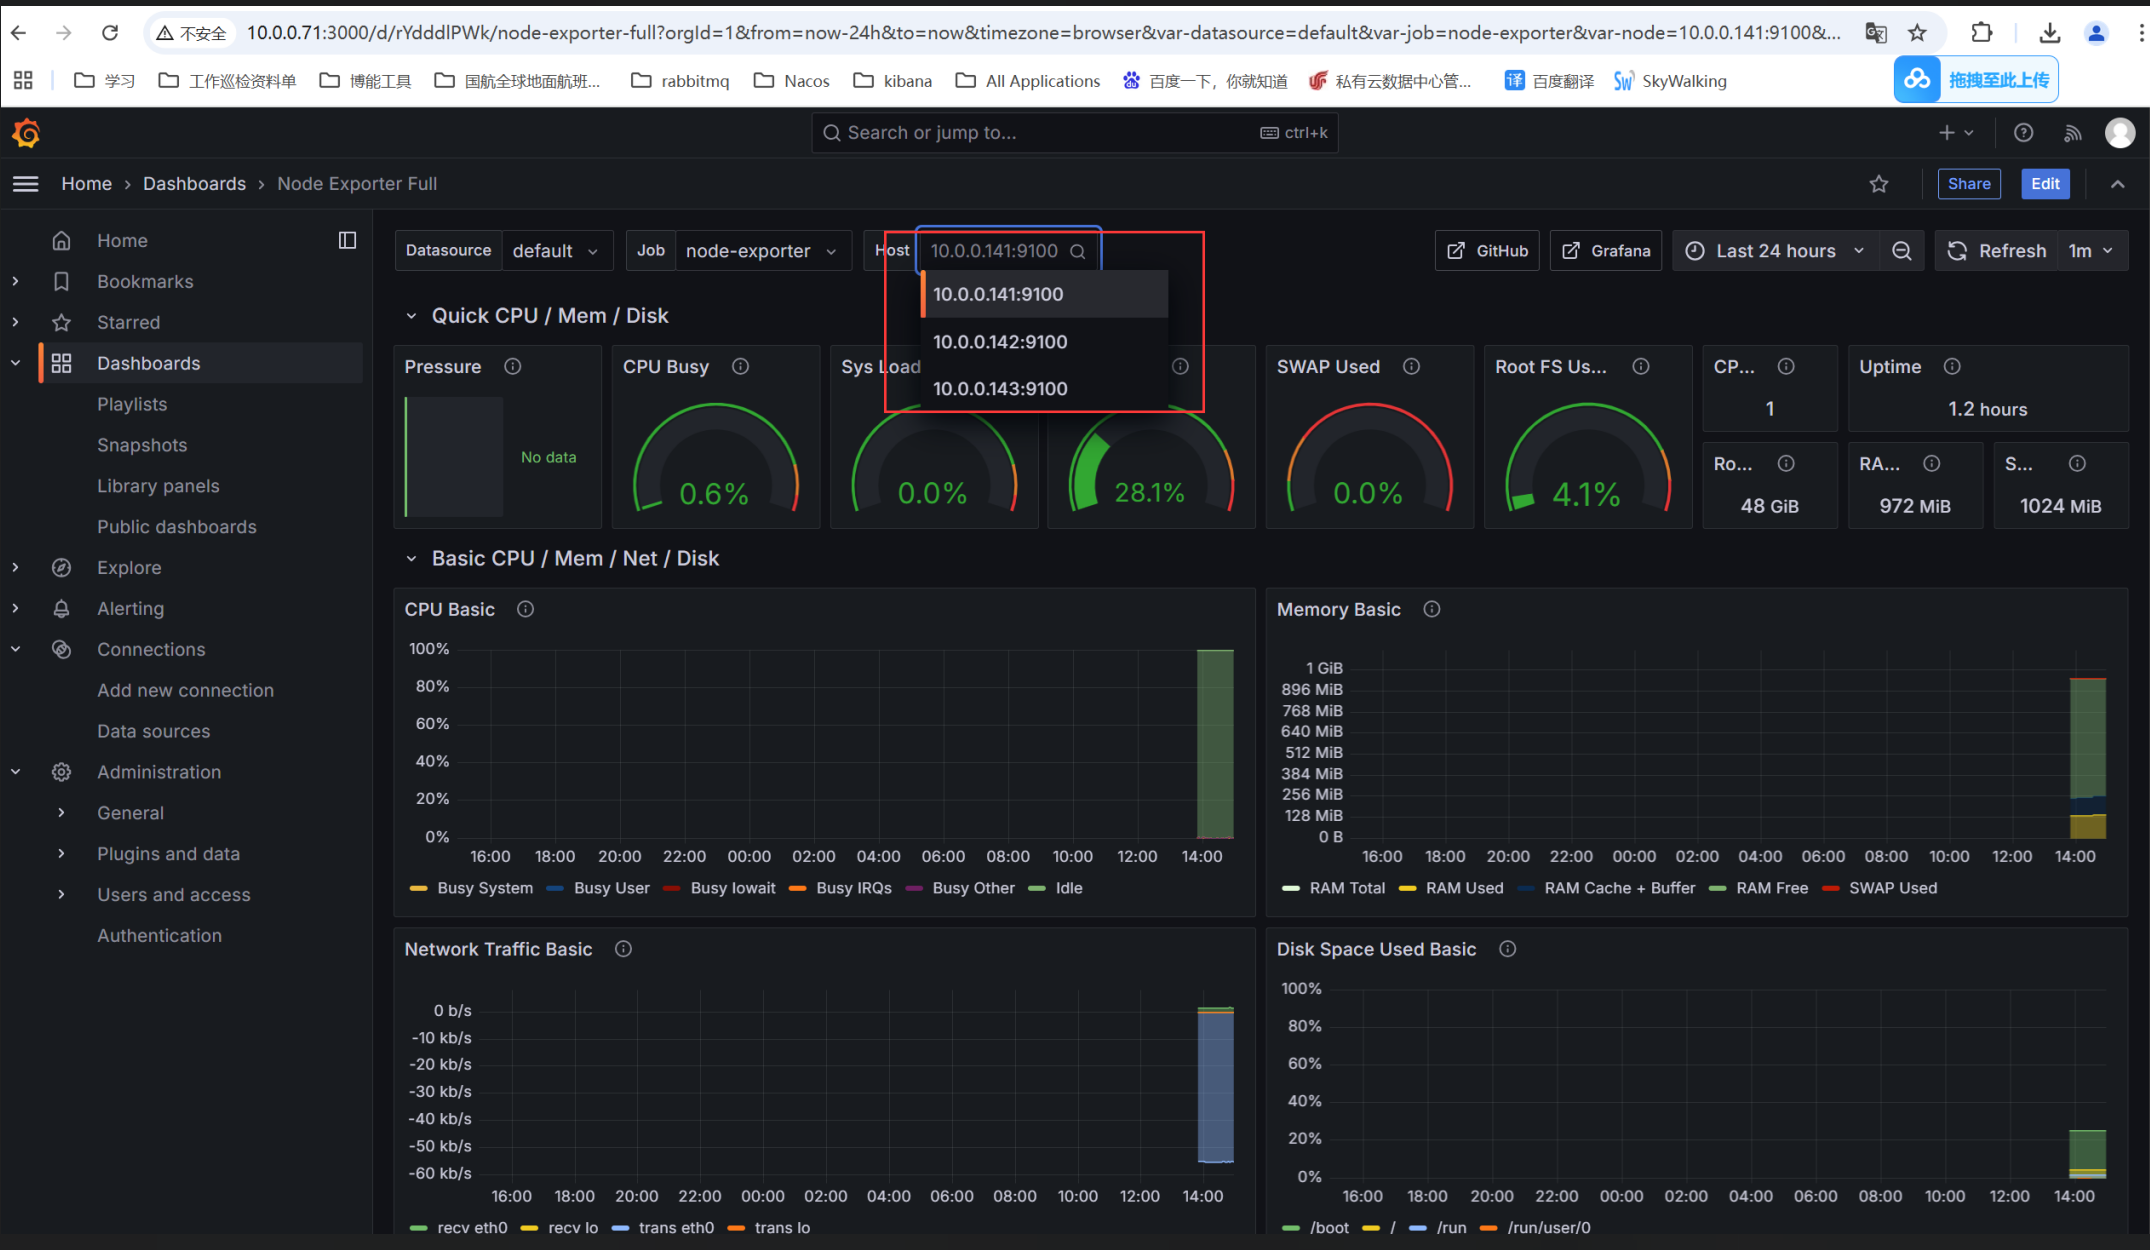
8.查看导入后的模板ID的dashboard
强